
Retail Reporting Suite
Warehouse-integrated dashboards replacing manual spreadsheets for weekly retail reporting.
ROLE
Data Analyst / Dashboard Designer
TIMELINE
3 months, 2025
TOOLS
Power BI, SQL, Excel
THE PROBLEM
Manual reporting was costing hours every week
Retail teams were spending 6+ hours weekly building manual spreadsheet reports from disconnected warehouse data — with no real-time visibility into sales trends, stock levels, or regional performance. Decisions were consistently made on outdated numbers.
THE APPROACH
From data audit to dashboard design
01
Data Audit
Mapped every data source feeding into weekly reports.
02
Warehouse Integration
Connected live inventory and sales data.
03
Dashboard Design
Built role-specific views in Power BI.
04
Testing & Rollout
Validated with actual reporting teams before launch.
THE SOLUTION
A live, role-specific dashboard replacing static weekly spreadsheets.
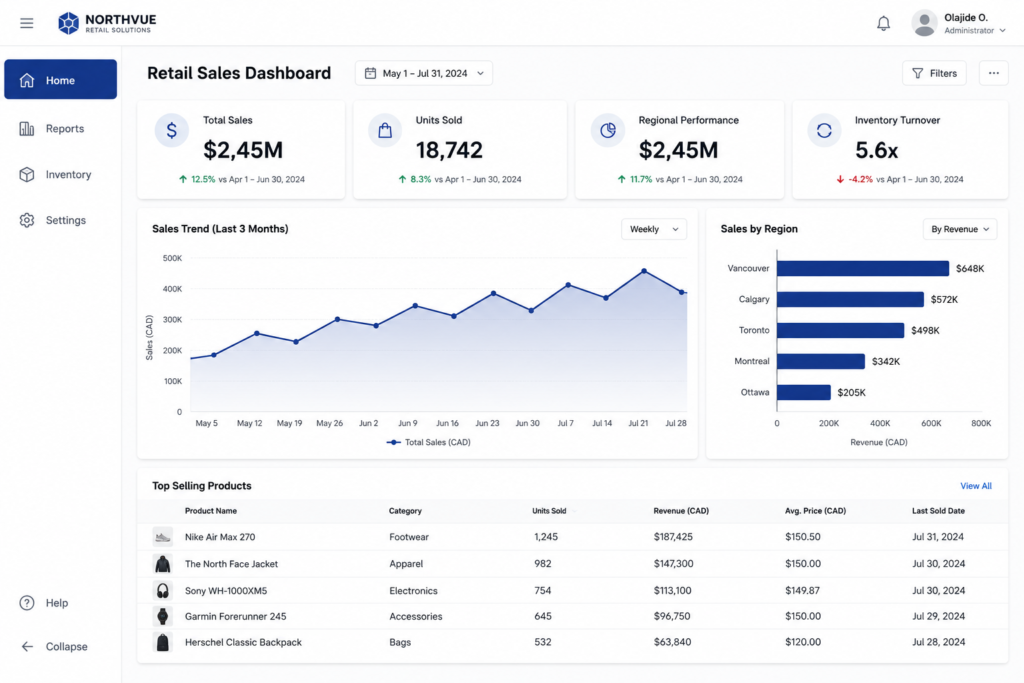
Regional sales overview with drill-down filtering.
THE OUTCOME
6 hrs → 15 min
Weekly reporting time
~90%
Faster report generation
Full team
Adopted across regional reporting
This project shifted the reporting process from a reactive, manual weekly task to a live, self-serve system — freeing up analyst time for higher-value work.